Your Geospace
Map Creator offers the possibility to visualize your own geo files with a tool called “Your Geospace”. You can upload your data into your geospace.
At the moment, the following formats are supported:
- GeoJson
- KML
- GPX
- Shapefile (ESRI)
- CSV
The GPX files will be shared with the community.
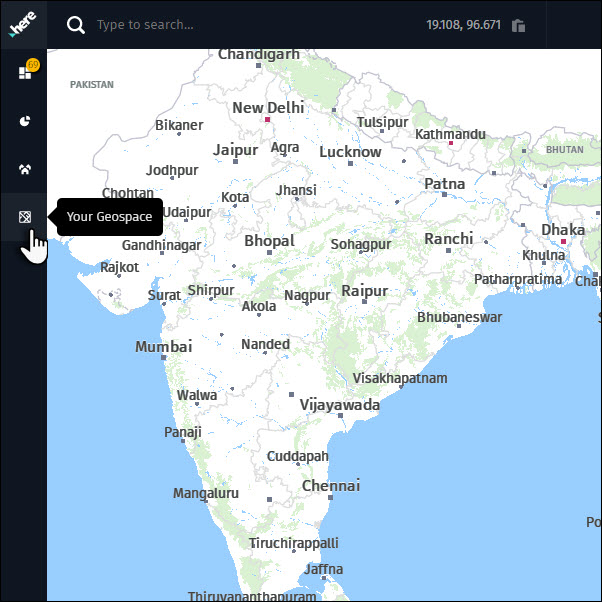
You can access Your Geospace from the Service bar on the left side.
1 Upload files
Uploading different types of files allows to visualize your personally collected data. You can upload the above types of geo data (as traces, waypoints, areas) and use a couple of functionalities within the tool to customize your data. To do so follow the steps as described below:
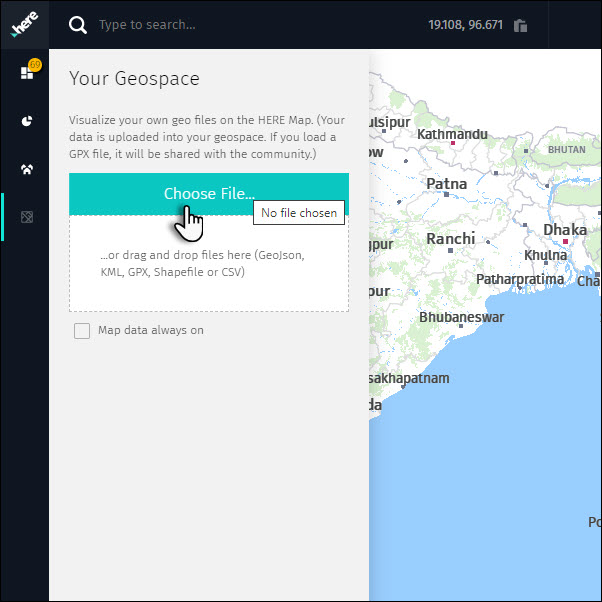
1) Click on the “Your Geospace” button to open the functionality and choose a file to upload or drag and drop a file.
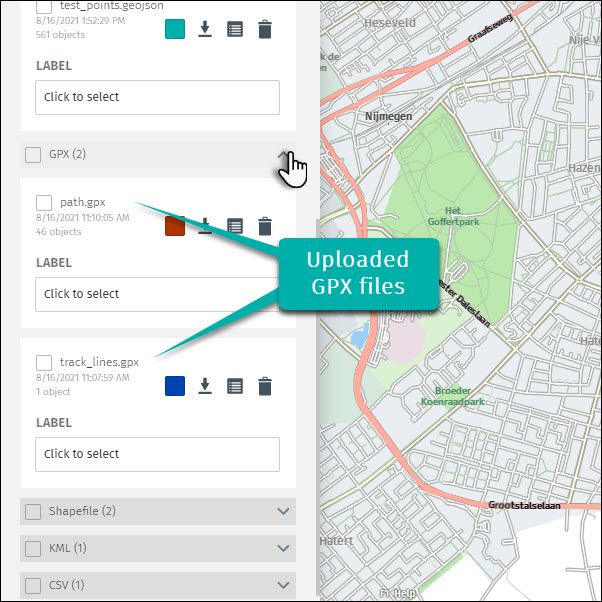
2) The uploaded files will be shown in the panel (the number next to each type shows the number of the files of that type, e.g. two GPX files and one of the other types, in the example below)
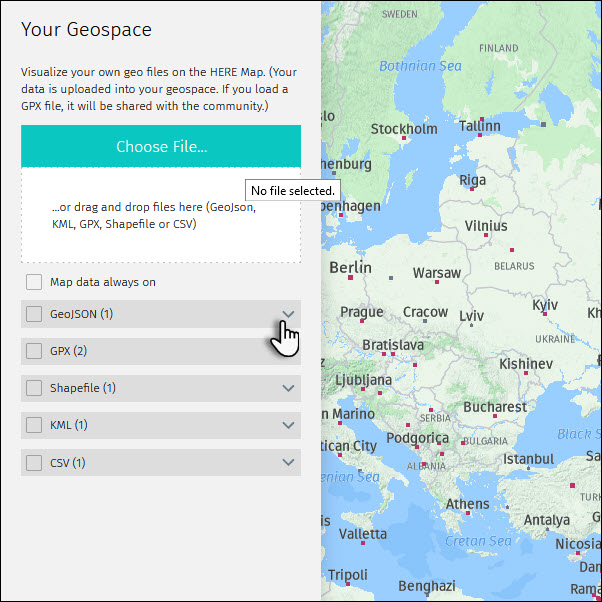
3) Press the arrow next to the file to visualize it/them.
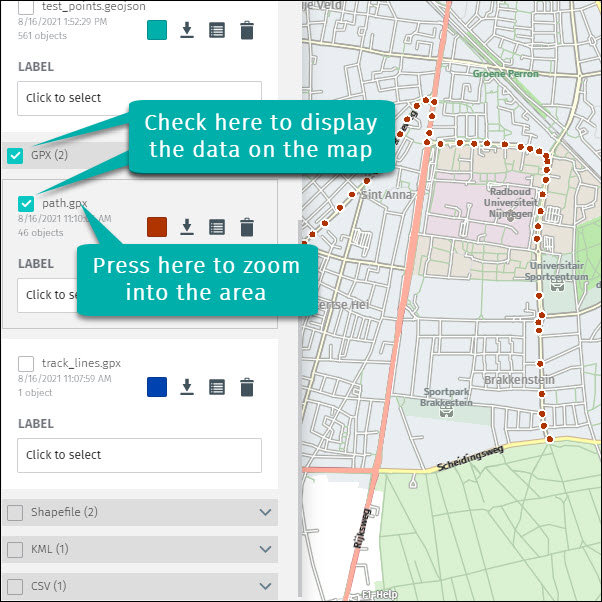
4) Pressing on the file, the map will zoom into the area covered by the corresponding file and checking both the file (path.gpx, in this case) and the type of the file (GPX, in this case) will display it on the map.
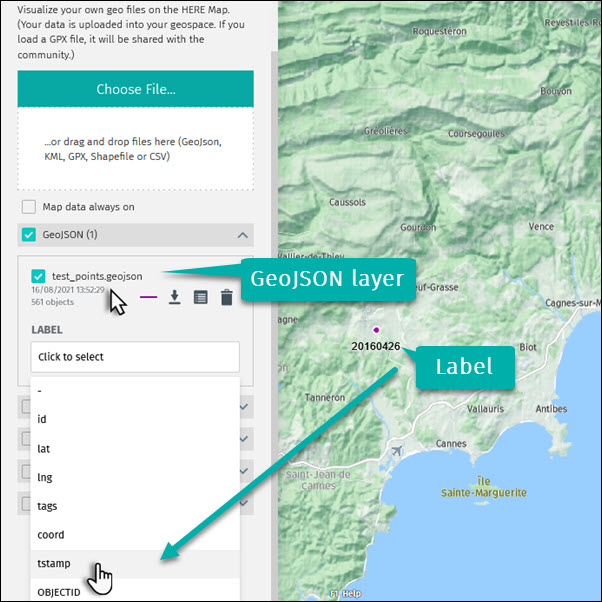
5) A label can be chosen to be displayed next to the symbol.
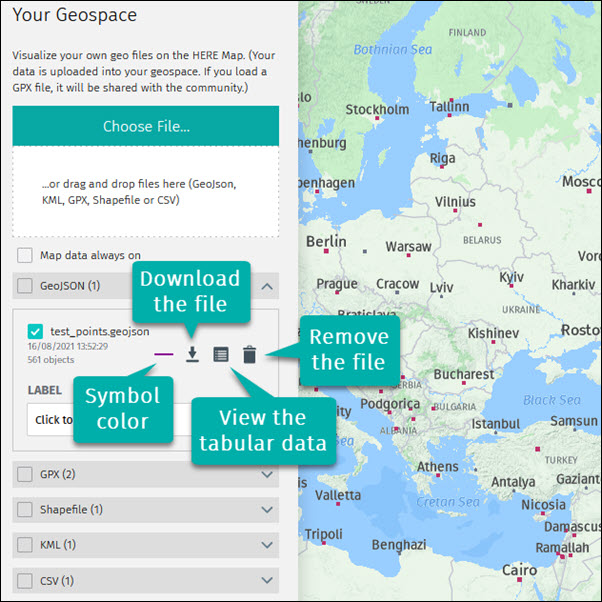
6) There are a few functionalities in the panel:
- Symbol color: the color of the data points, lines or polygons can be changed
- Download file
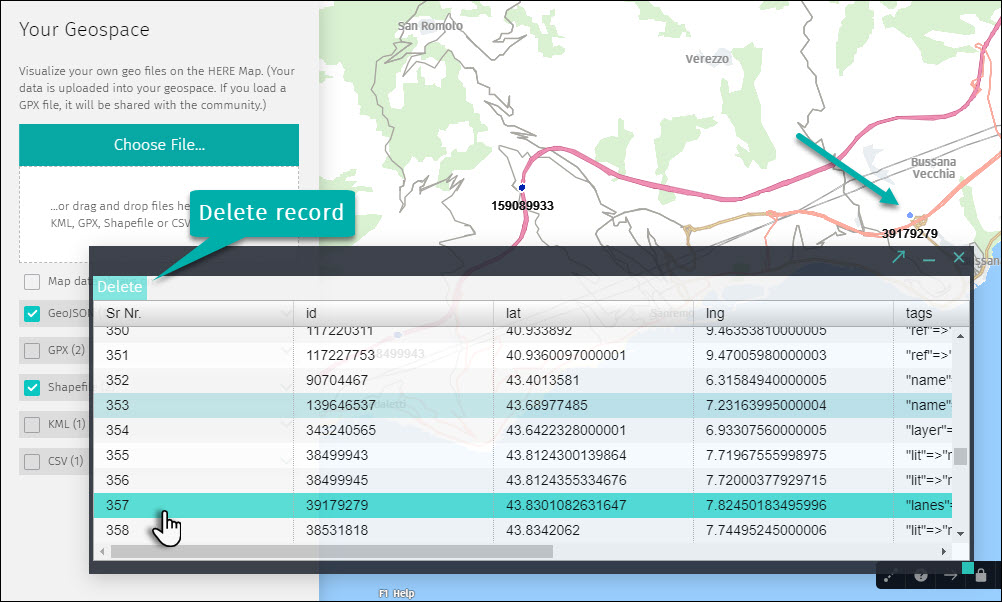
- View the tabular data: the data can be visualize in a table within Map Creator
- Remove the file: the data will be removed from “Your Geospace” and will not be seen by other users anymore.
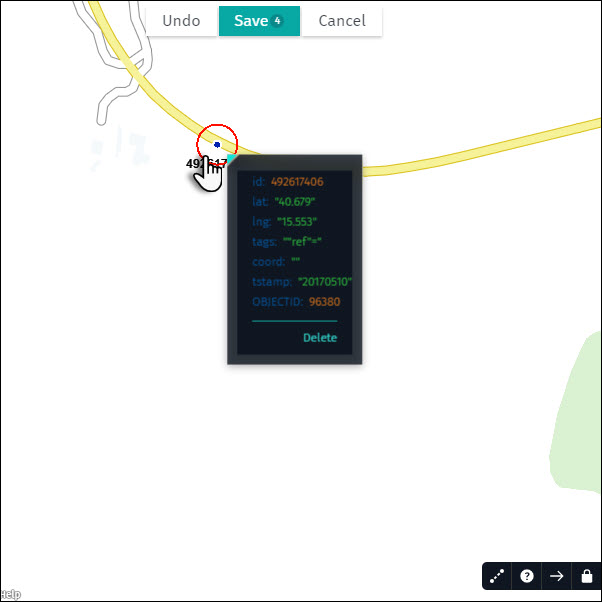
7) The records can be selected to visualize the corresponding information. In the same time, the records can be modified by changing their position (by dragging them) or they can be removed from the data. To make permanent changes in the data, the edits should be saved (in the upper menu).
8) To make edits in the attributes of the data, the table functionality can be used. Double click in a cell and make the desired changes, then save them from the upper menu. There is also the possibility to select more records and delete them in the same time.
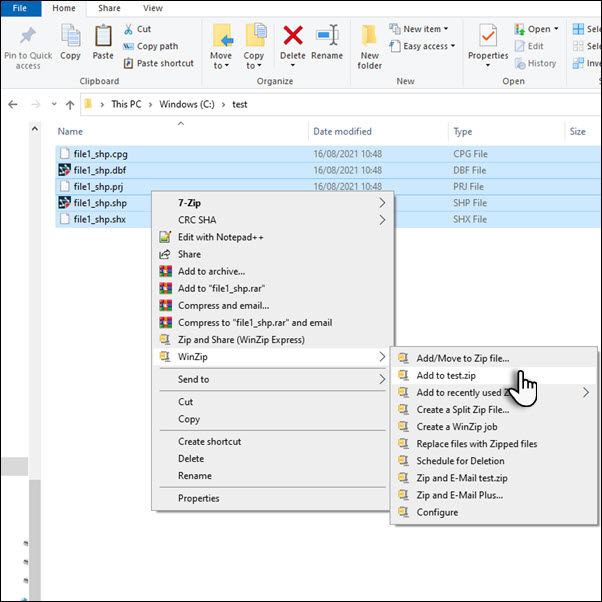
Note:
The ESRI shapefile can be uploaded as an archived file (zip format) that comprises all the composing files.